scROAD - Single-cell Regulatory Occupancy Archive in Dementia
Welcome to the Single-cell Regulatory Occupancy Archive in Dementia

How can scATAC-seq data be utilized to study gene regulation and chromatin accessibility in diseases?
scATAC-seq data enables us to explore chromatin accessibility at a single-cell level, allowing for the identification of regulatory elements that are active in specific cell types. This technique is particularly powerful for investigating transcription factor binding sites (TFBS) and understanding gene regulatory networks in the context of complex diseases like Alzheimer's Disease (AD) and Pick's Disease (PiD).
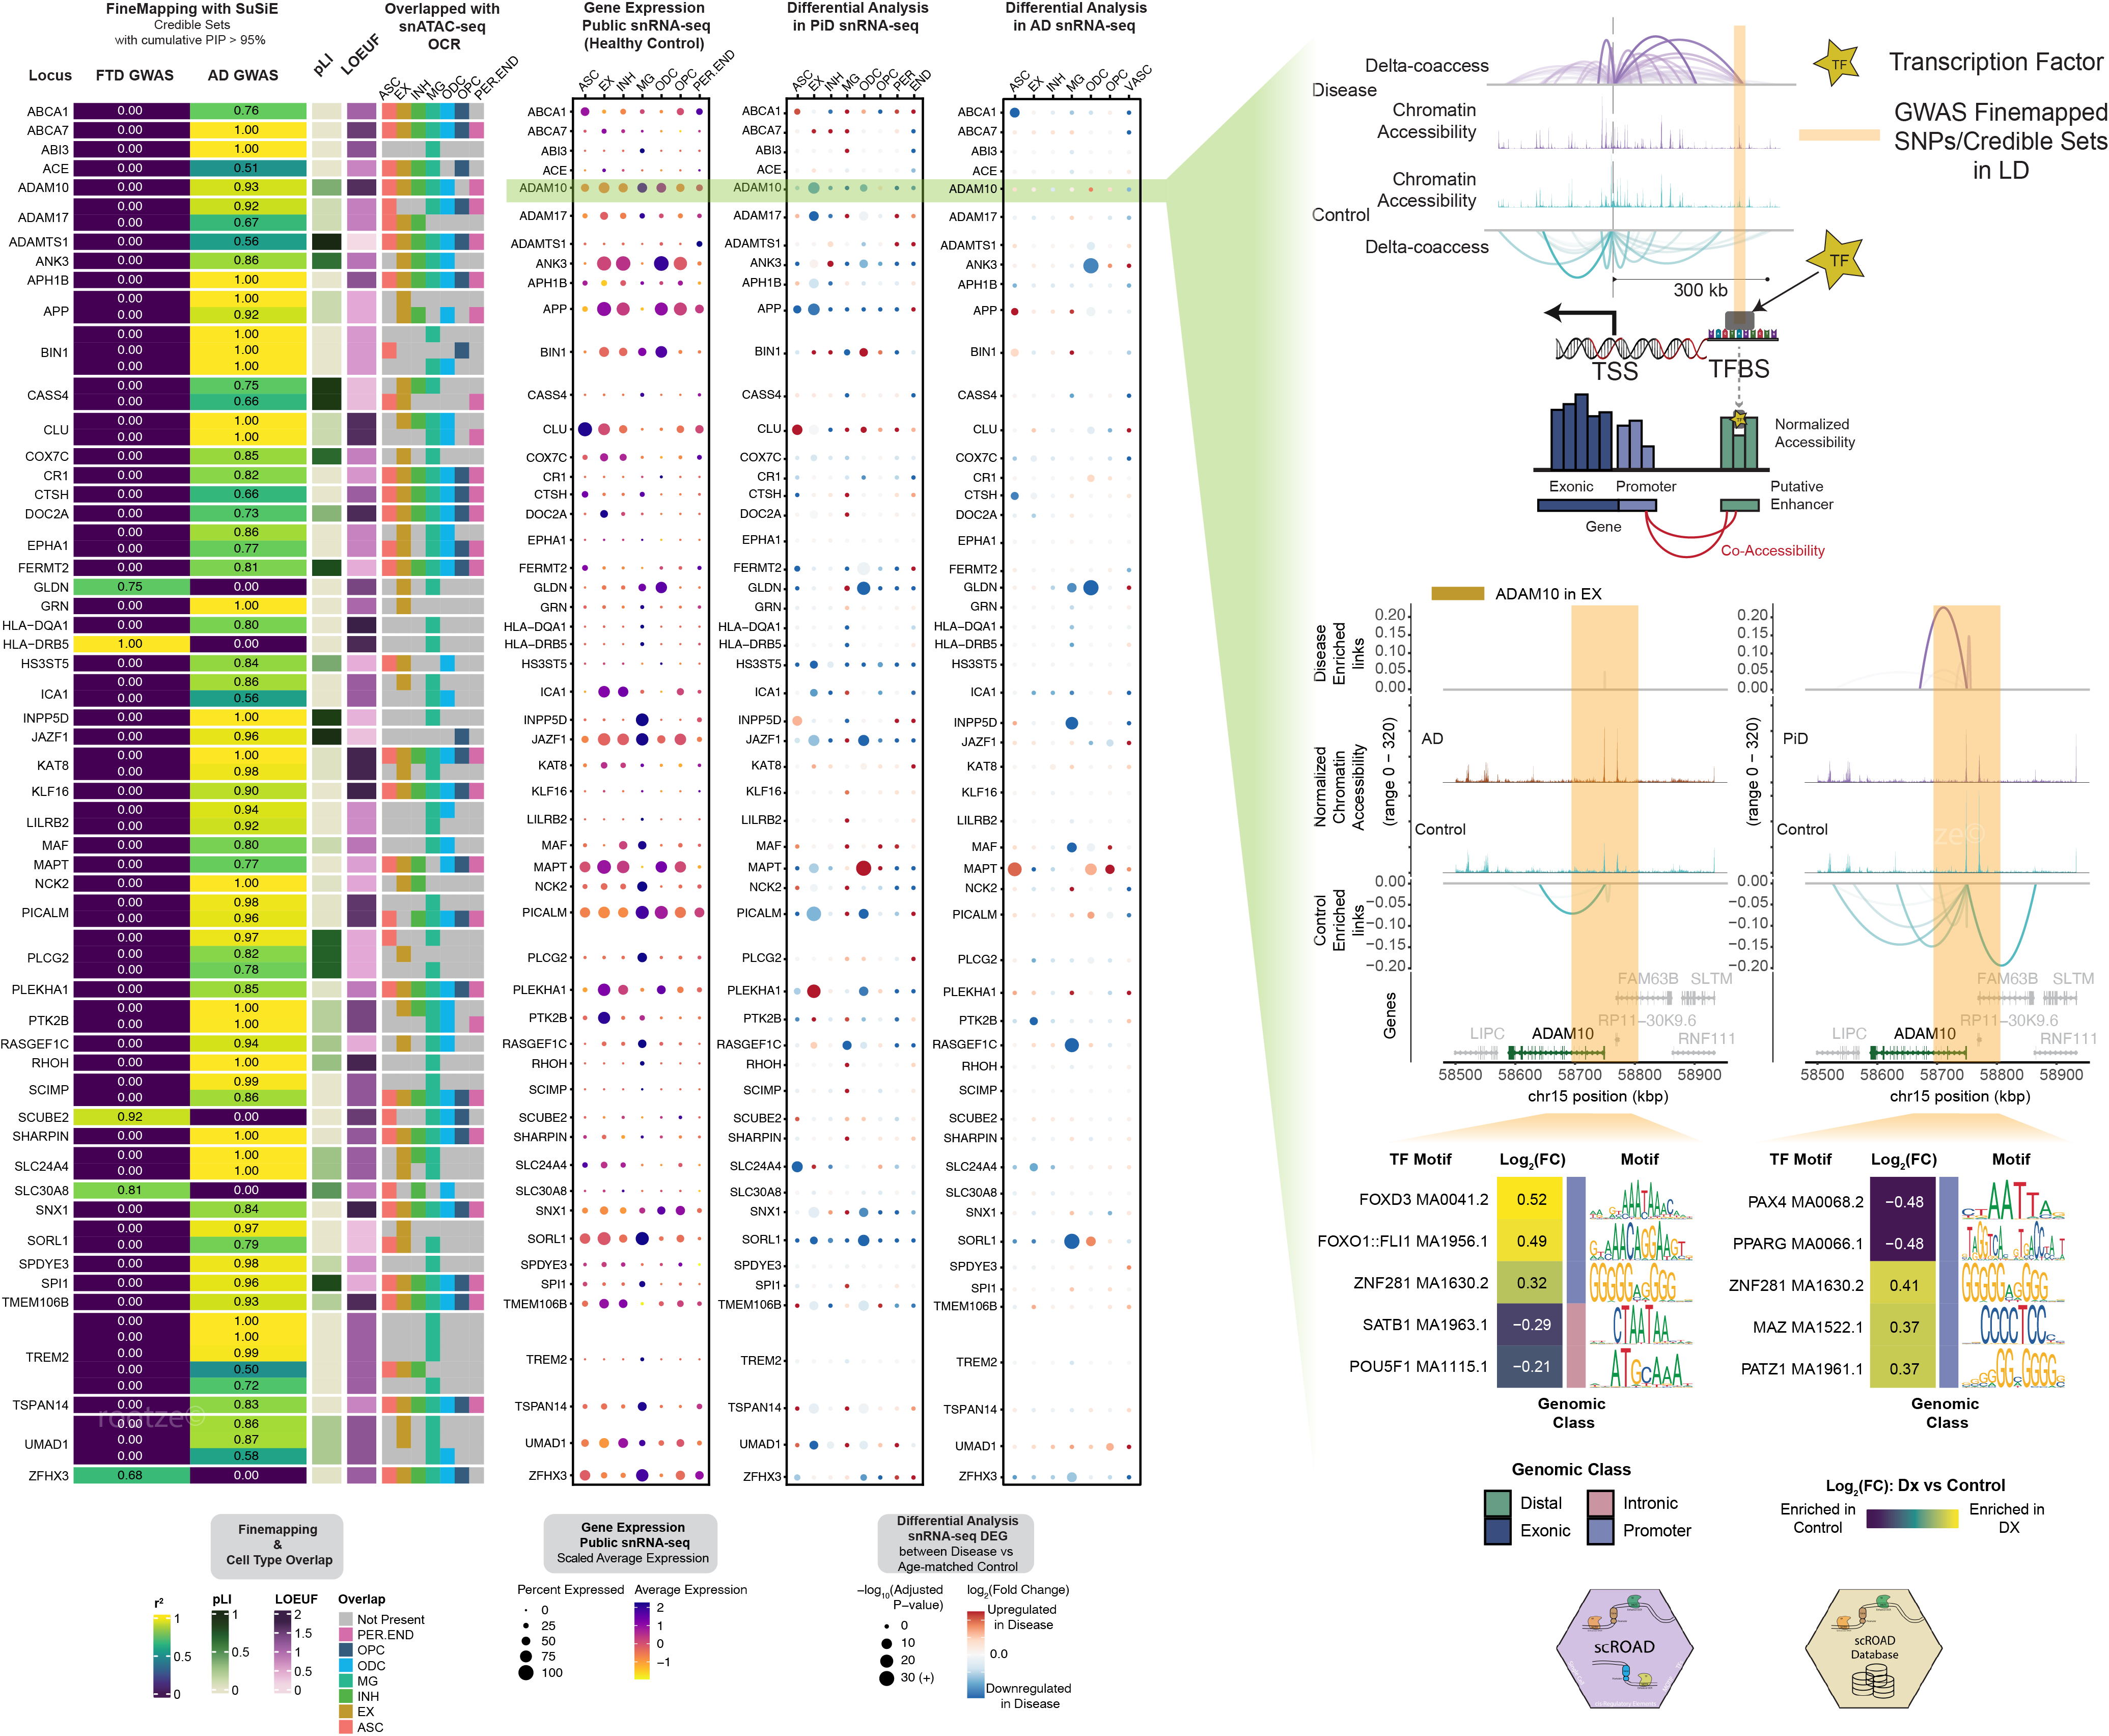
Our comprehensive approach integrates genomic data from various sources, including GWAS fine-mapping, single-nucleus ATAC-seq (snATAC-seq), and single-nucleus RNA-seq (snRNA-seq), to uncover the genetic underpinnings of neurodegenerative diseases. By mapping disease-associated loci to specific cell types, we can investigate the functional alternations due to genetic variants in disease contexts, such as AD and PiD.
I developed this interactive database, scROAD, which integrates single-cell chromatin data processed with Signac, cis-regulatory links inferred by Cicero, and TF binding occupancy profiles generated using TOBIAS. We performed single cell co-accessibility analyses using Cicero to construct putative cis-regulatory enhancer-promoter links. Additionally, with the help from TOBIAS package, we can further explore transcription factor (TF) binding occupancy in ATAC-seq. This analysis allows us to detect differences in TF binding between disease and control samples, providing insights into how regulatory mechanisms are altered in specific cell types. By integrating TF binding data with co-accessibility analyses to create this scROAD interactive database, users can easily explore transcription factor binding activity and their implications in disease, providing a valuable resource for understanding gene regulation in neurodegeneration.
About the Database
This database offers comprehensive information on single-cell cCRE transcription factor occupancy data generated from snATAC-seq analysis of human postmortem prefrontal cortex (PFC) tissue. The data specifically focuses on Alzheimer's Disease and Pick's Disease. For a more in-depth understanding of the database's purpose and contents, please refer to the following publication. If you have any further questions, feel free to contact the principal investigator.
How to Cite
Shi Z, Das S, Morabito S, Stocksdale J, Miyoshi E, Emerson N, Srinivasan SS, Shahin A, Rahimzadeh N, Cao Z, Silva J, Castaneda AA, Head E, Thompson L, Swarup V. Single-nucleus multi-omics identifies shared and distinct pathways in Pick's and Alzheimer's disease. Sci. Adv. 11, eads7973 (2025). DOI: 10.1126/sciadv.ads7973
Complete Code for the Science Advances Project
Please check out the complete analysis & code for this project at GitHub: scMultiomics_identifies_shared_and_distinct_pathways_in_PiDandAD.
Developer Information
Name: Zechuan Shi
GitHub: rootze.github.io
Principal Investigator
Name: Vivek Swarup
Lab Website: https://swaruplab.bio.uci.edu/
Explanation of TF Occupancy Data Frame Columns
Below is an explanation of the columns included in the TF Occupancy data frame:
- Peak1: Peak1 open chromatin regions (OCRs)
- Peak1_nearestGene: Nearest gene to Promoter Peak1
- Peak1_type: Promoter - Peak Type of Peak1, and this is set by us to be promoter for easy investigation of links from Peak2 OCRs to Peak1 Promoter
- Peak2: Peak2 open chromatin regions
- Peak2_type: Peak Types of Peak2 -- Enhancer, which includes Distal and Intronic, and Exonic OCRs
- chr: Chromosome
- delta_coaccess_dx_vs_cnt: Difference in coaccessibility between disease and control
- Celltype: Type of cell
- Study: Study from which the data is derived, AD or PiD
- TFBS_chr: Chromosome of the Transcription Factor Binding Sites (TFBSs)
- TFBS_start: Start position of the TFBS
- TFBS_end: End position of the TFBS
- TFBS_name: Name of the transcription factor binding site
- TFBS_strand: Strand of the TFBS
- target_peak_chr: Chromosome of the target peak for the investigation of TFBS occupancy
- target_peak_start: Start position of the target peak for the investigation of TFBS occupancy
- target_peak_end: End position of the target peak for the investigation of TFBS occupancy
- control_bound: Control TF binding information on the target peak, 1 means [bound / binding], 0 means [no bound / no binding]
- dx_bound: Disease TF binding information on the target peak
- log2FC_TFBS: log2 fold-changes estimated from TOBIAS activity scores on the target peak, calculated by comparing Disease and Control
Tutorial for TF Occupancy Data Explorer
Follow these steps to use the TF Occupancy Data Explorer:
-
Step 1: Decide Your Search Criteria
Determine Your Focus: Decide whether you want to search for data based on a Target Gene, Transcription Factor (TF), Chromosome Base Position, or a combination of these.
- Target Gene: If you are interested in exploring transcription factor occupancy related to a specific gene.
- Transcription Factor: If your focus is on how a particular TF interacts across different regions or genes.
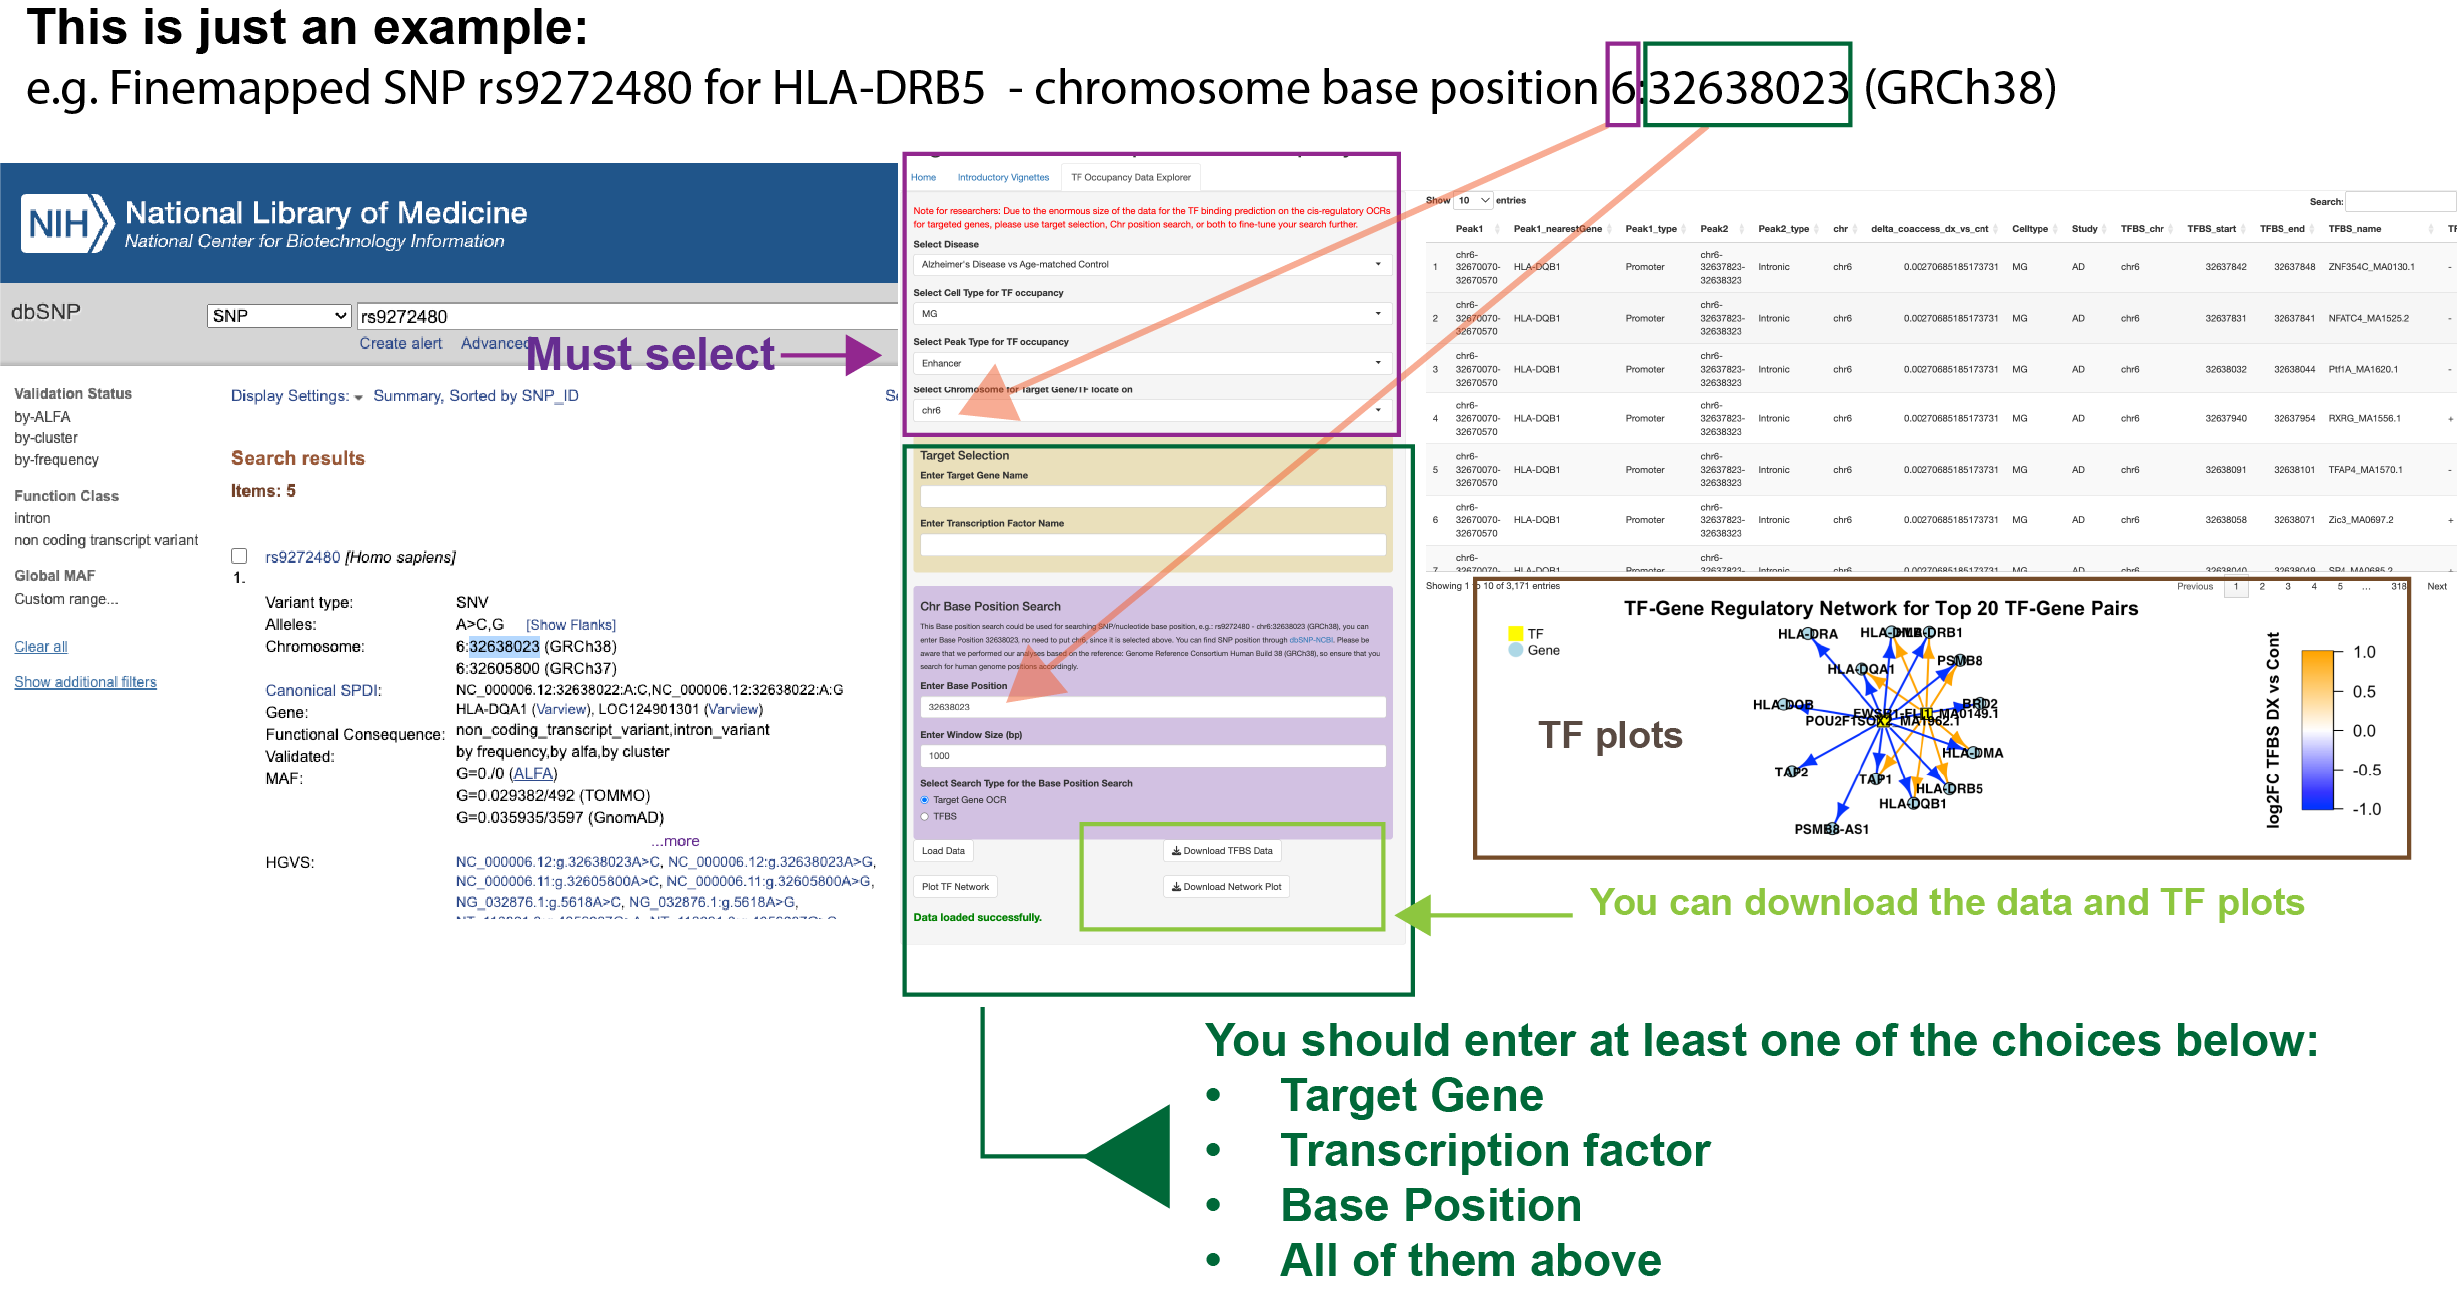
- Chromosome Base Position: If you have a specific genomic location of interest (e.g., from an SNP).
-
Step 2: Enter Your Search Parameters in the TF Occupancy Database
Access the TF Occupancy Database: Navigate to the single-cell cCRE Transcription Factor Occupancy Database in Dementia Research.
- Option 1 - Target Gene Search:
- Enter Target Gene Name: In the 'Target Selection' section, input the name of the gene you’re interested in.
- (Optional) Enter TF Name: If you want to narrow down the search to a specific TF interacting with this gene, enter the TF name.
- Option 2 - Transcription Factor Search:
- Enter Transcription Factor Name: In the 'Target Selection' section, input the name of the TF to explore its occupancy across different genomic regions.
- (Optional) Enter Target Gene Name: If you want to focus on a particular gene that interacts with this TF, enter the gene name.
- Option 3 - Chromosome Base Position Search (Optional):
- Enter Chromosome Base Position: If you also have a specific chromosome base position, input it in the 'Chr Base Position Search' section.
- Set Window Size: Define the search window size (e.g., 1000 bp) around the base position to refine the region of interest.
- Select Search Type, Target Gene OCR or TFBS, for the Base Position Search.
-
Step 3: Load Data and View Results
Load Data: Click on the 'Load Data' button to retrieve data based on the criteria you entered.
View Results: The database will display relevant entries, including peak information, transcription factor binding, cell type, and more.
Download Data and Plots: You can download the data and transcription factor plots by using the available buttons.
-
Step 4: Analyze the Results
Inspect TF Plots: Review the TF-Gene Regulatory Network plots generated from the data to visualize interactions between transcription factors and target genes.
Use Data for Further Analysis: Utilize the downloaded data for deeper analysis, such as studying transcription factor occupancy patterns in different cell types or diseases.
Unveiling TF Footprinting: A New Frontier in Regulatory Network Analysis for Neurodegenerative Disease
Introduction
Understanding transcription factor (TF) binding is essential for unraveling the complex regulatory networks underlying gene expression. Tools like scATAC-seq offer unprecedented opportunities to study chromatin accessibility at the single-cell level, shedding light on gene regulation and its dysregulation in disease. However, existing methods for analyzing TF networks often fall short of distinguishing functional TF binding events from non-functional motifs. In this blog, we explore a novel approach leveraging TF footprinting to overcome these limitations, offering new insights into neurodegenerative diseases like Alzheimer's Disease (AD) and Pick's Disease (PiD).
Challenges in Current Methods
Widely used methods such as SCENIC (Aibar et al., 2017) and SCENIC+ (Bravo González-Blas et al., 2023) rely on conventional motif enrichment analyses to construct gene regulatory networks (GRNs). While SCENIC uses promoter regions and co-expression patterns from scRNA-seq data, SCENIC+ extends this by integrating scATAC-seq and scRNA-seq data to link enhancers to target genes.
However, these methods have notable limitations:
- They infer TF activity indirectly through overrepresented motifs, which can lead to false positives.
- They struggle to distinguish functional enhancer-TF interactions from non-functional motifs.
For instance, a multi-omic study in AD (Mathys et al., 2024) demonstrated the utility of SCENIC in constructing cell-type-level TF regulators in AD snRNA-seq data. SCENIC+, on the other hand, builds on this by using pycistarget, a wrapper for HOMER, for enhancer motif enrichment. Unfortunately, these approaches often miss the mark in identifying true TF binding events.
Limitations of Open Chromatin as a Regulatory Marker
A common assumption in chromatin accessibility studies is that open chromatin regions correlate with active regulatory elements. However, recent findings challenge this notion.
Studies like Xiong et al., 2023 revealed that increased chromatin accessibility in neurodegenerative diseases often reflects chromatin relaxation rather than functional regulation. Similarly, Frost et al., 2014 observed chromatin relaxation and heterochromatin loss in tauopathies such as PiD and AD. These 'relaxed' chromatin regions may not indicate meaningful regulatory activity, as they often lack functional TF binding.
Further complicating the picture, Baek et al., 2017 reported that 80% of TF binding motifs do not show measurable footprints, suggesting that open chromatin alone is an unreliable indicator of active regulation. Methods like SCENIC and SCENIC+ may still infer TF activity in these regions, potentially resulting in false positives.
This phenomenon is illustrated in Fig. 1 below, where we depict two scenarios: (1) open chromatin regions with TF binding ('functional regulation') and (2) open chromatin regions without TF binding ('chromatin relaxation').
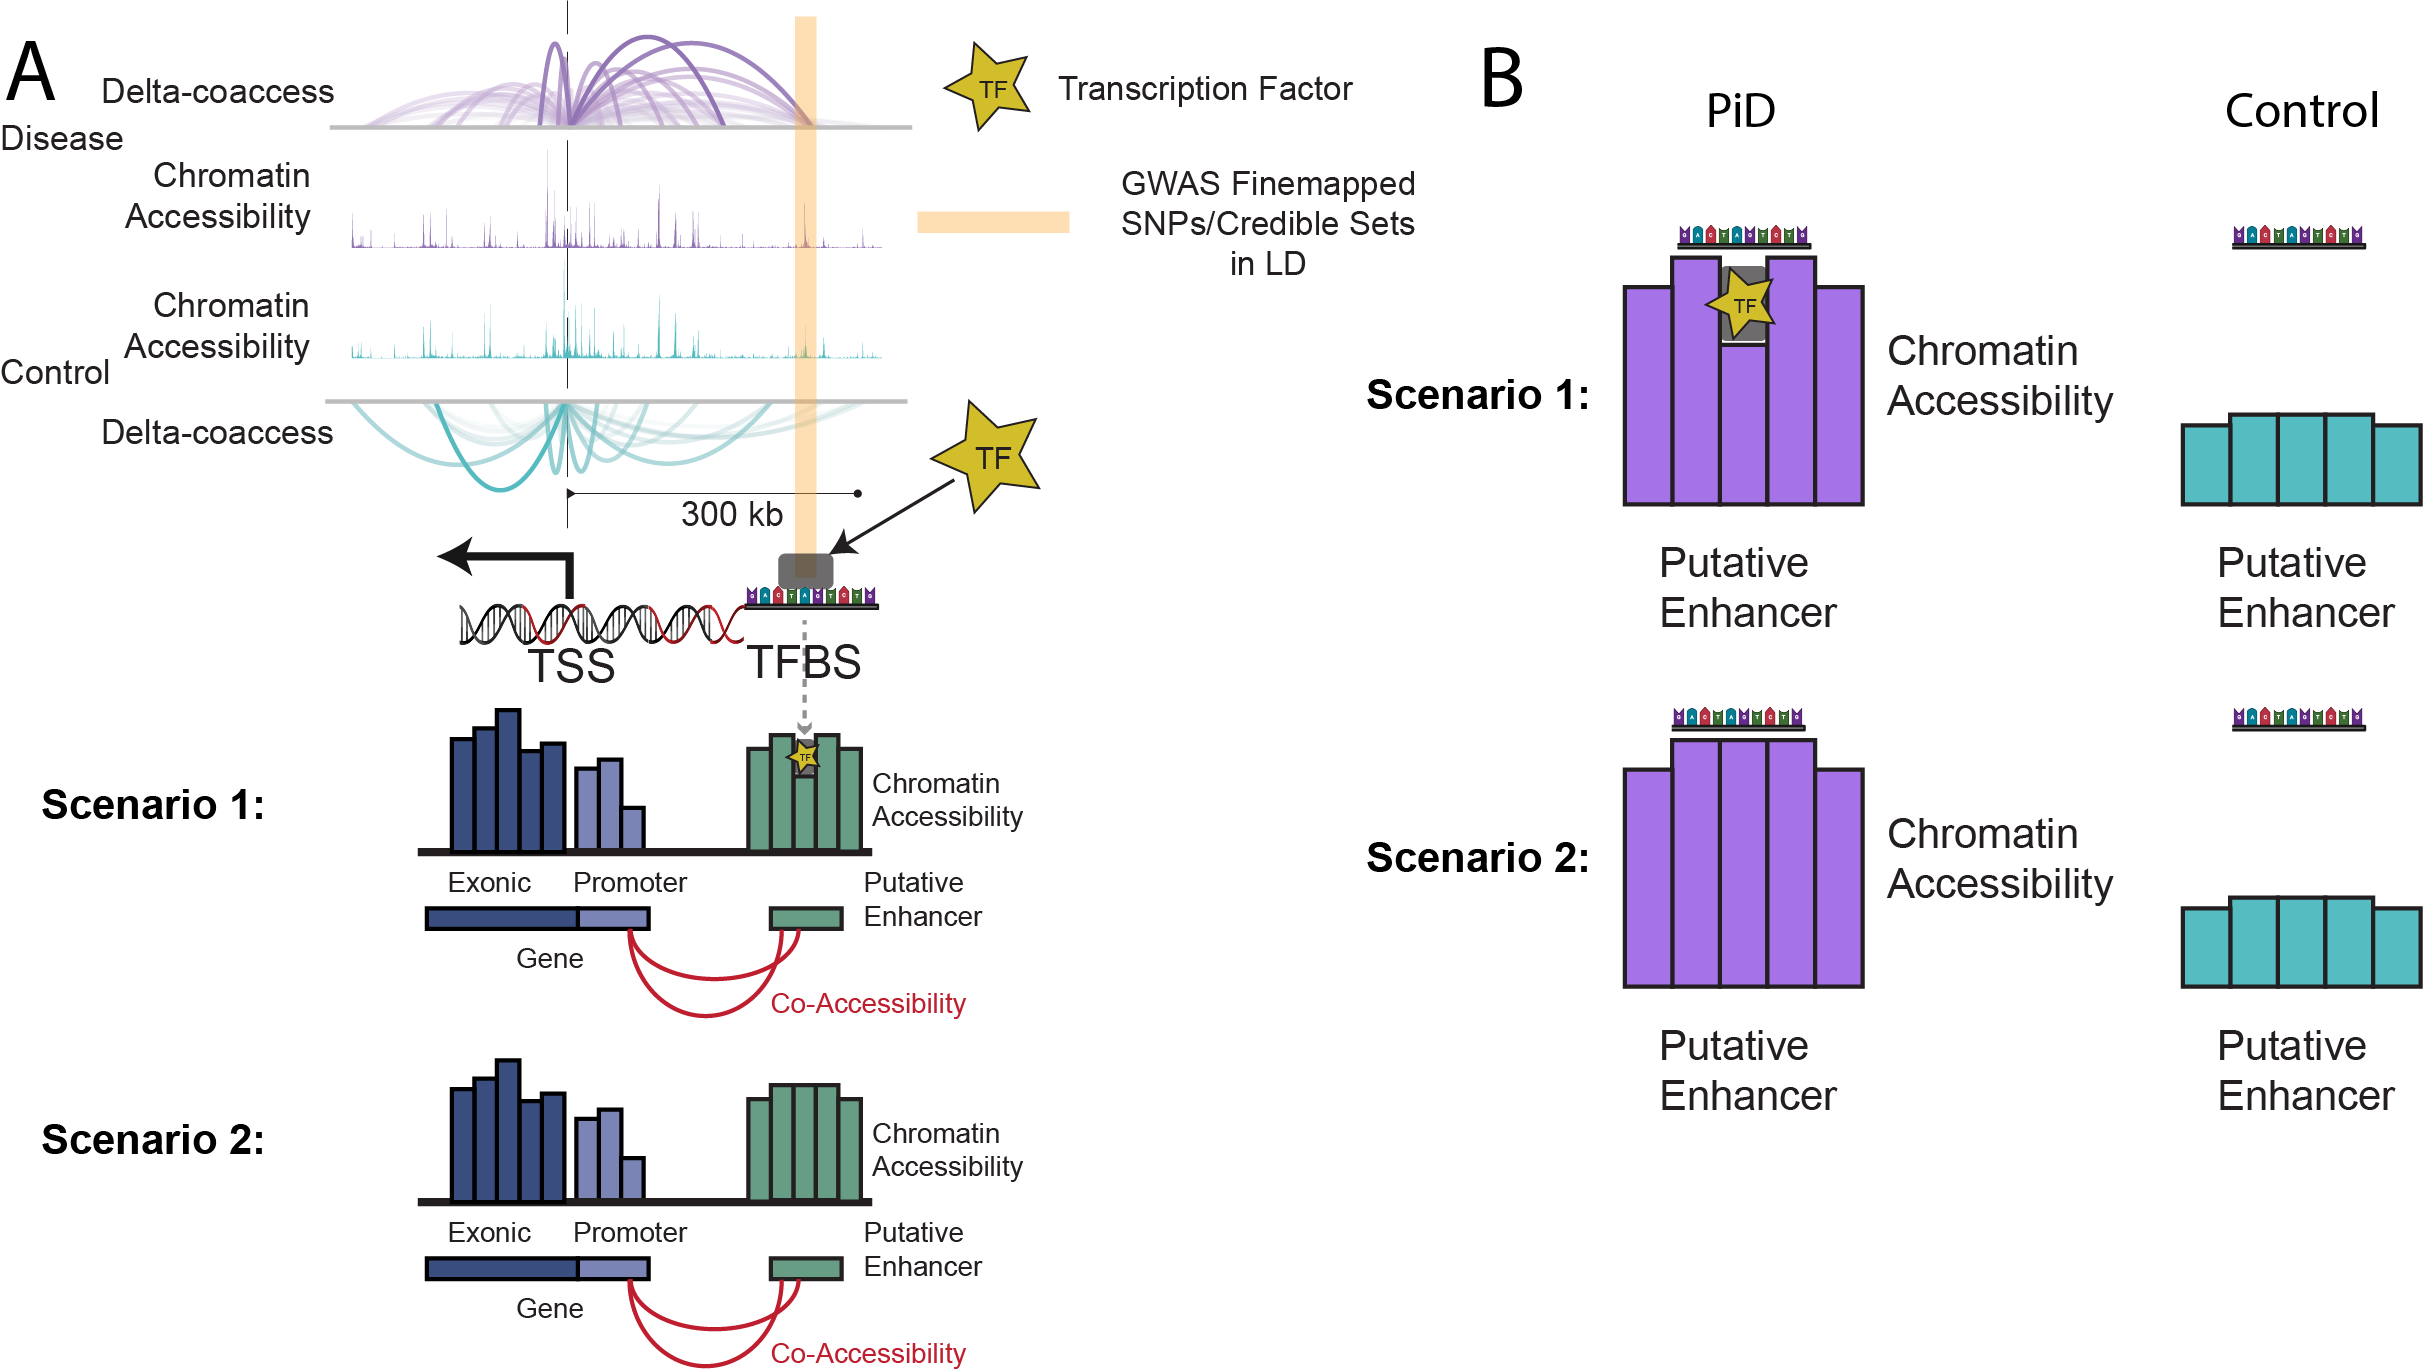
Fig. 1 shows two key scenarios of transcription factor binding in open chromatin regions. Scenario 1 highlights regions where open chromatin coincides with functional TF binding, while Scenario 2 depicts regions with open chromatin but without active TF binding, indicating chromatin relaxation rather than regulation.
A Functional TF Footprinting Approach for Disease-Related Regulatory Networks
To address these challenges, we reimplement a bulk ATAC method on single cell data that incorporates TF footprinting and motif-flanking accessibility using the TOBIAS package. This approach offers a more accurate and confident way to identify active TF binding events.
- TOBIAS calculates TF occupancy across all accessible chromatin regions, allowing us to:
- Distinguish TF-occupied enhancers from non-functional motifs.
- Assess footprinting at binding sites and motif-flanking accessibility.
- Compare TF occupancy between disease and control conditions.
- Key Advantages of the TF Footprinting Approach on Disease Related Regulatory Network:
- Direct Measurement of TF Occupancy: Unlike SCENIC and SCENIC+, which rely on motif enrichment, our method directly measures TF binding, reducing false positives.
- Higher-Resolution Insights: By distinguishing functional enhancer-TF interactions from non-functional motifs, we provide a more accurate view of regulatory networks.
- Enhanced Integration: Combining snATAC-seq and snRNA-seq data allows for comprehensive analyses of TF-mediated regulation in specific cell types.
Implications for Neurodegenerative Disease Research
This method holds significant promise for advancing our understanding of transcriptional regulation in neurodegenerative diseases like AD and PiD. By uncovering true TF binding events and regulatory interactions, we can identify novel therapeutic targets and gain new insights into disease mechanisms.
For example, this approach can help clarify the role of chromatin accessibility changes in neurodegeneration, distinguishing functional regulation from non-functional chromatin relaxation. Additionally, it provides a valuable resource for exploring TF activity and its implications in disease contexts.
Conclusion
This functional TF footprinting approach represents a major step forward in regulatory network analysis, addressing the limitations of conventional methods like SCENIC and SCENIC+. By leveraging tools like TOBIAS to measure TF occupancy directly, we can distinguish functional regulatory events from non-functional motifs, providing deeper insights into gene regulation in neurodegenerative diseases. As we continue to refine these methods, they will undoubtedly play a critical role in shaping the future of genomic research and therapeutic discovery.
References
- S. Aibar, C. B. González-Blas, T. Moerman, V. A. Huynh-Thu, H. Imrichova, G. Hulselmans, F. Rambow, J. C. Marine, P. Geurts, J. Aerts, et al., SCENIC: single-cell regulatory network inference and clustering. Nat. Methods 14, 1083–1086 (2017). DOI: 10.1038/nmeth.4463
- C. Bravo González-Blas, S. De Winter, G. Hulselmans, N. Hecker, I. Matetovici, V. Christiaens, S. Poovathingal, J. Wouters, S. Aibar, S. Aerts, SCENIC+: single-cell multiomic inference of enhancers and gene regulatory networks. Nat. Methods 20, 1355–1367 (2023). DOI: 10.1038/s41592-023-01938-4
- H. Mathys, C. A. Boix, L. A. Akay, Z. Xia, J. Davila-Velderrain, A. P. Ng, X. Jiang, G. Abdelhady, K. Galani, J. Mantero, N. Band, B. T. James, S. Babu, F. Galiana-Melendez, K. Louderback, D. Prokopenko, R. E. Tanzi, D. A. Bennett, L. H. Tsai, M. Kellis, Single-cell multiregion dissection of Alzheimer's disease. Nature 632, 858–868 (2024). DOI: 10.1038/s41586-024-07606-7
- X. Xiong, B. T. James, C. A. Boix, Y. P. Park, K. Galani, M. B. Victor, N. Sun, L. Hou, L. L. Ho, J. Mantero, A. N. Scannail, V. Dileep, W. Dong, H. Mathys, D. A. Bennett, L. H. Tsai, M. Kellis, Epigenomic dissection of Alzheimer's disease pinpoints causal variants and reveals epigenome erosion. Cell 186, 4422–4437.e21 (2023). DOI: 10.1016/j.cell.2023.08.040
- B. Frost, M. Hemberg, J. Lewis, M. B. Feany, Tau promotes neurodegeneration through global chromatin relaxation. Nat. Neurosci. 17, 357–366 (2014). DOI: 10.1038/nn.3639
- S. Baek, I. Goldstein, G. L. Hager, Bivariate genomic footprinting detects changes in transcription factor activity. Cell Rep. 19, 1710–1722 (2017). DOI: 10.1016/j.celrep.2017.05.003
- M. Bentsen, P. Goymann, H. Schultheis, K. Klee, A. Petrova, R. Wiegandt, A. Fust, J. Preussner, C. Kuenne, T. Braun, et al., ATAC-seq footprinting unravels kinetics of transcription factor binding during zygotic genome activation. Nat. Commun. 11, 4267 (2020). DOI: 10.1038/s41467-020-18035-1